

Forecast where consumer spending will surge before the moment arrives.
G5 Analytics is a proprietary AI-driven platform that predicts real-world forces, such as events and weather impacts, that drive consumer spending surges — so your team can capture demand instead of chasing it.
With the data behind G5’s Surge Events and Environmental Spend Potential (ESP), you will know weeks and months ahead of where your consumers are going to be spending. Put your budgets where demand is going, not where it’s been.
every US DMA

The 2026 World Cup will generate $2.38B in US surge spending.
See where and when across 78 matches, 11 host DMAs, and all 38 days of the tournament
Surge Markets
Stop reacting. Start predicting.
Here is where spending is surging.
G5 Analytics defines where and when spending will surge, by sector and DMA, months ahead of the actual event. Walk into every meeting with opportunity maps and demand forecasts, not just reach metrics.
Top Surge Markets June 2026
Surge ForecastThe Opportunity
G5 Analytics predicts
the reason for consumer
spend before it happens.
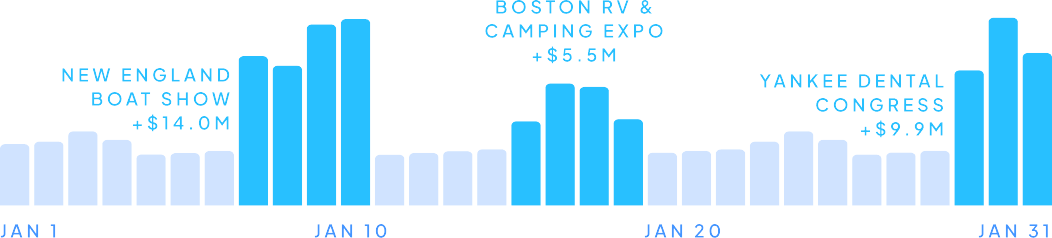
Events, weather, and real-world forces create predictable demand spikes and contractions in the market. Yet most teams are still budgeting from last quarter's numbers. We provide transparency into these spending shifts so that marketing, advertising and leadership teams can always stay one step ahead.
G5 Analytics tells you where and when spikes and declines in spending will occur so you can improve your ROI on advertising and operational expenditures.
Learn More ⟶Boston Seaport January 2026
Daily Baseline Spend
Always-On View

Event-Adjusted Spend
Surge Signal
Our Solutions
Two products, one platform.
From always-on to always-optimized.
Spend potential is dynamic and it is directly influenced by both surge events and weather impacts. With Surge and Environmental Spend Potential (ESP), we give your team the insights to shift budgets to where demand is about to surge, pulling back where it’s about to contract.
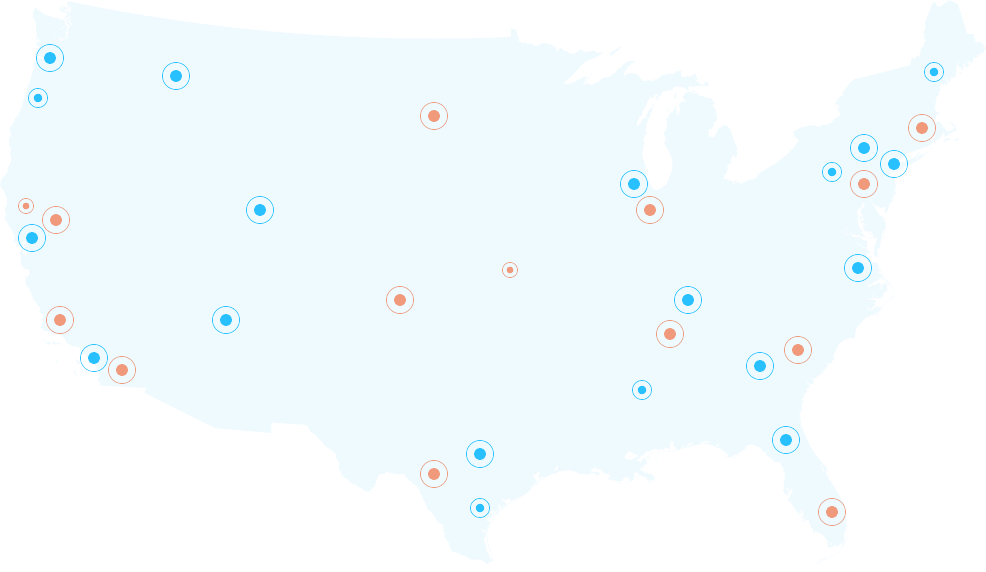
Event-Driven Demand Signals
Identifies where and when consumer spending will spike around conventions, concerts, sporting events, and festivals. Forecastable months in advance across 14 sectors.
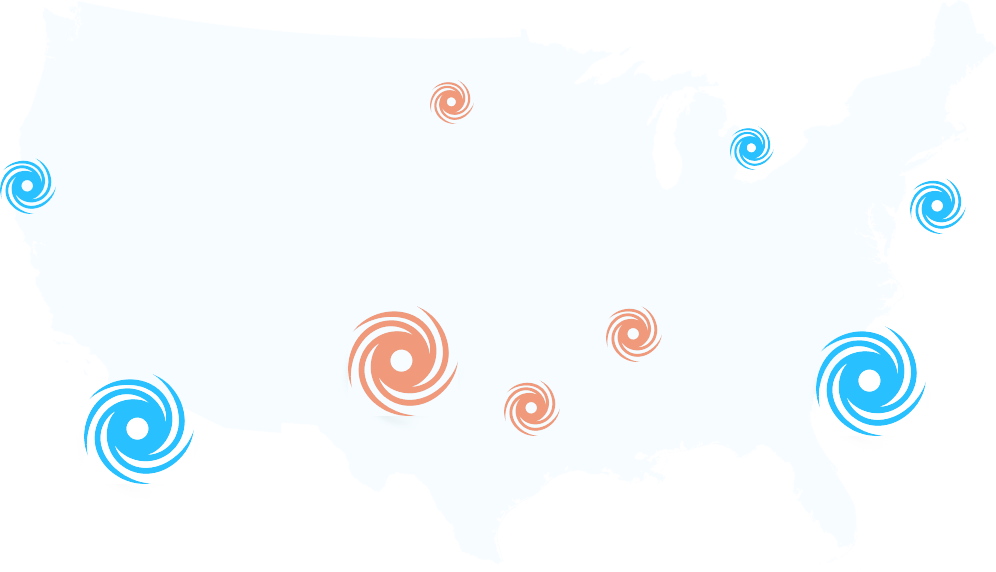
Weather-Driven Spend Impact
Our data converts hourly forecasts into sector-level spend impact by DMA — including channel shift between in-store and online. Covers 17 sectors across 4 industry families.
Who We Serve
Built for the teams that control where budgets go.
We work with the teams shaping modern commerce and media; from the brands and retailers building lasting customer relationships, to the agencies driving campaign performance, to the advertising platforms powering it all at scale.
-
Concentrate budgets where demand is most likely to surge weeks before it appears in any sales report or media rate card. Improve operational planning and media returns simultaneously.
-
Walk into every client conversation with opportunity maps and demand forecasts, not just reach metrics. Provide your clients with the data to define where and when spending will surge, by sector and DMA, months ahead.
-
G5 Analytics aligns directly with advertising platforms, giving buyers a data-driven reason to concentrate spend, not spread it thin across always-on inventory.
Our Foundation
Built by the team that set the standard for consumer spending intelligence.
G5 Analytics’ founders spent over two decades building and operating the nation’s leading consumer spending intelligence infrastructure. The benchmark data became the most widely cited source of US consumer spending data, trusted by government institutions, financial markets, and major media.
We don't react to disruption, we anticipate it. Our proprietary models track how events ripple through spending in real time, so you're always a step ahead: the signal before the surge.

We’re accepting a limited number of clients to our pilot program.
G5 Analytics is working with a select group of brands, agencies and advertising platforms giving early access to surge forecast data before we go live in Q4 2026.
Contact Us
Let’s talk about what’s moving in your market.
Contact us if you are ready to join the founding pilot, want a briefing on a specific DMA or sector, or just want to see the data.